
From Excel to an interactive
dashboard in a minute.
Start from a ready template, or design your own from scratch. Tablio builds the cards, charts and tables from your file's data, keeps the dashboard inside the file itself, and exports it as an image, PDF, PowerPoint or an interactive HTML page that works offline.
- No credit card
- Your files are never stored
- Arabic & English

How do you build the management report today?
- You copy figures from Excel into the slides every week and redraw the charts.
- Every periodic data update means rebuilding the report from scratch.
- The dashboard lives in a separate tool, never travels with the file and can't be opened on a phone.
How it works
Start easily
From a ready template, from scratch, from a saved design file, or by editing your current dashboard. 19 ready designs and 18 colour packs.
Add and arrange items
Figures, gauges, charts, timelines, tables, matrices, notes and slicers, on a 12-column grid, up to 10 pages.
Update and export
Pick a period to see any earlier update, then export: PNG, PDF, an editable PowerPoint, Excel or interactive HTML.
The result
- 10 project-management report templates, each with an Excel form you fill in to see the dashboard at once.
- Update periods: the dashboard opens on the latest update, picking an earlier period updates everything, and the trend over time stays complete.
- Interactive HTML that works offline and on phones, limited to the user's permissions and the dashboard's columns.
- Editable PowerPoint at the page size, with native charts and their data.
- Filters on 4 levels, relationships between tables, and copying or moving items between pages.
- The dashboard is saved inside the Excel file itself, for everyone who opens it in Tablio.
“The weekly management report used to take a whole morning. Now I upload the updated file and export.”
Everything a management report needs
Figures & gauges
The figure, a second figure, a breakdown by another column, and gauges with a target and how much of it is reached.
Charts
Column, bar, line, area, pie, doughnut, radar, stacked and 100%, column with line, funnel and scatter.
Trend & forecast
Trend lines and forecasts on charts, with the standard terms: X-axis, Values, Legend and Tooltips.
Timeline
Start, today and end, progress, and days left or overdue.
Tables & matrices
With cell formatting, totals and value shading.
Slicers & page navigator
Filter the whole dashboard in a click, and move between its pages.
Notes & icons
Wrapping text or values from a column, and a searchable library of 268 icons.
Precise layout
A 12-column grid, a ruler, item sizes in centimetres, and up to 10 pages.
Dashboards, explained on video
A clear dashboard for every report
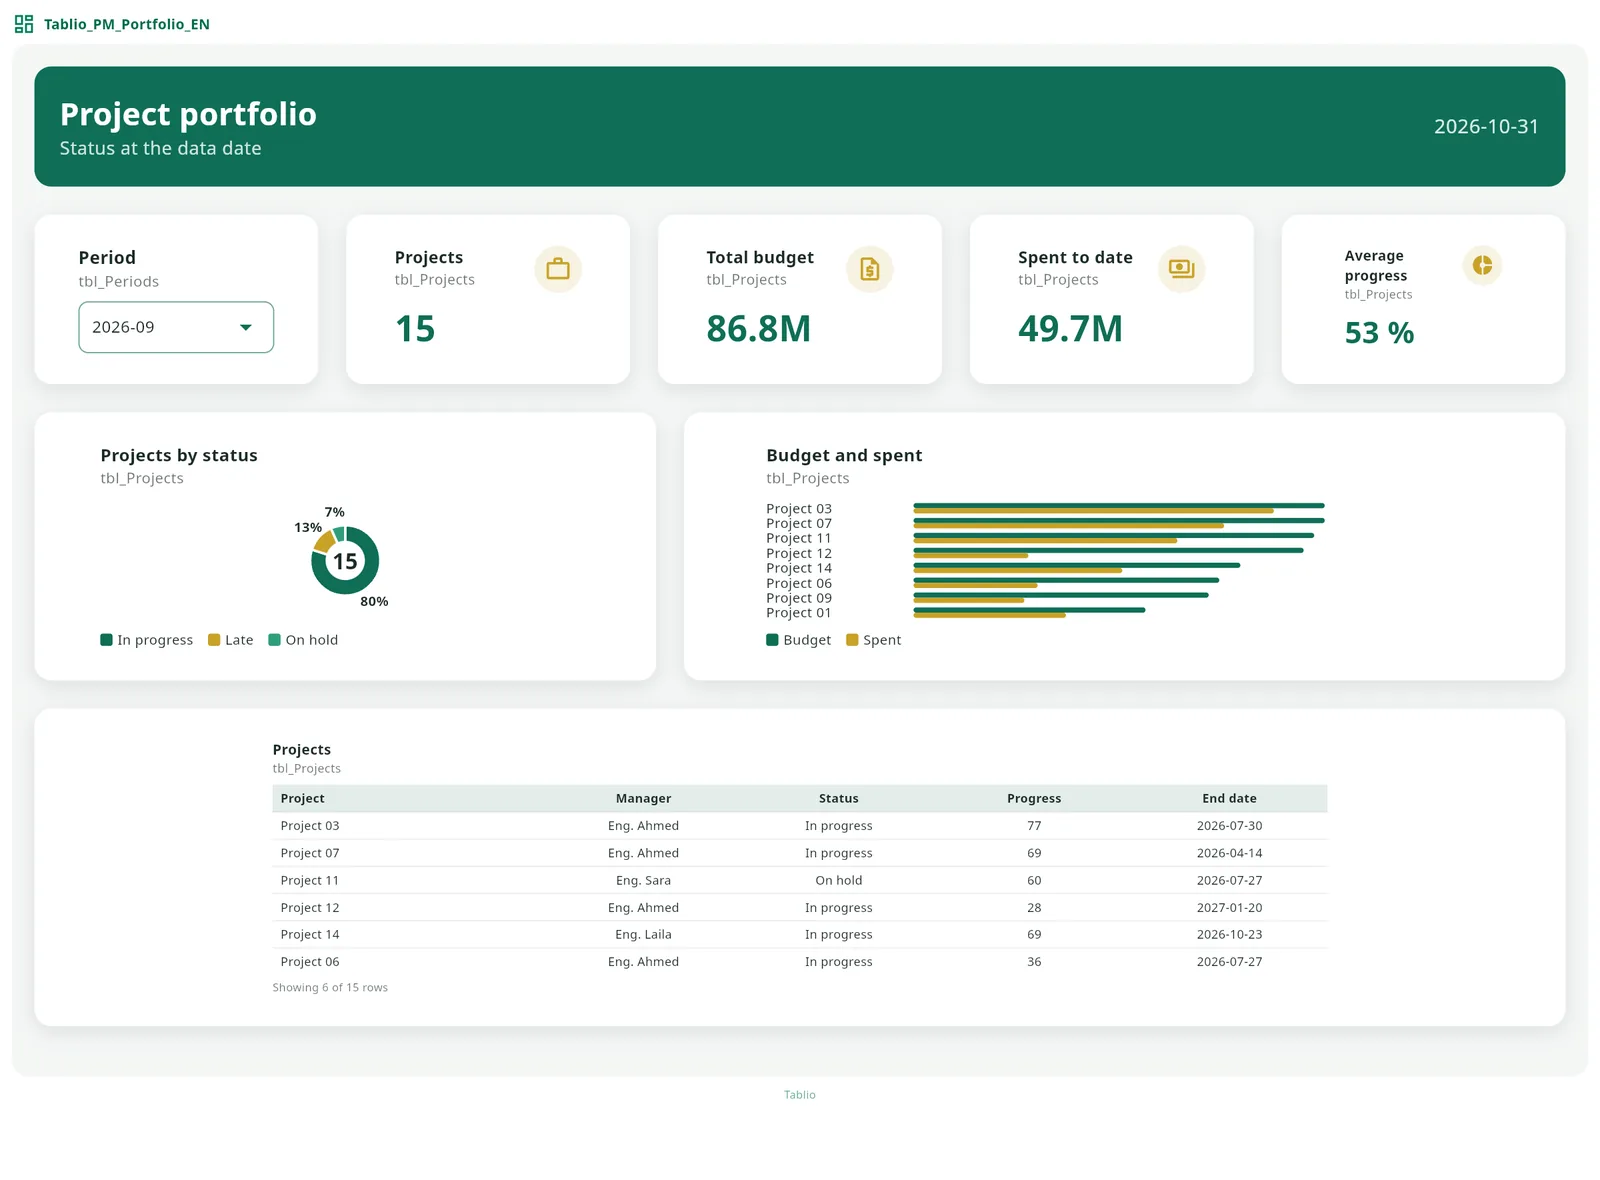
Real dashboards from Tablio’s project-management templates, with demo data.


On export: PDF gives a page for each dashboard page, PowerPoint keeps the page size, Excel shows the pages as sections of one sheet, and HTML is one interactive page.
A real dashboard, running in your browser
This is the “Project portfolio” dashboard as Tablio exports it, an interactive HTML page with demo data. Try the filters, periods and pages on a computer or phone, no sign-up needed.
Opens in a new tab; about 10 MB.
Build your first dashboard today
Try all of Tablio free for 28 days. No credit card, no commitment.