
Ten project-management dashboards,
ready from an Excel form.
Pick the template in Tablio, download its Excel form, fill it with your project's data, then upload it: the dashboard appears at once, in Arabic or English. With every periodic update you see the latest period, and the trend over time.
- No credit card
- Your files are never stored
- Arabic & English

Why is the project report always late?
- Every project has its own report format, rebuilt every month.
- S-curves and earned value need complex formulas and charts.
- Management wants one consistent picture of every project, and there isn't time.
How it works
Pick a template
In “Reports”, choose “From a ready template”, then the right one.
Fill in the Excel form
Download the form inside the app and fill it with your project's data, or paste your data in.
Upload it and see the dashboard
Upload the file and the dashboard appears at once. With each update add the new period, and the trend stays complete.
The result
- Ten templates in Arabic and English, each with a ready Excel form.
- A dashboard on desktop and phone, exported as PDF, PowerPoint or interactive HTML.
- Periodic updates: the latest first, and any earlier period in a click.
- A template is a starting point: change its items and design as you like.
“We presented the earned-value report to management the same day the site update arrived.”
A ready dashboard for every report in your project
Real screens from Tablio with demo data. The templates’ Excel forms are downloaded inside the app.

Project portfolio
Every project at a glance: progress, budget and spend, and status.

S-curve & progress
Planned against actual progress over time, and progress by work item.

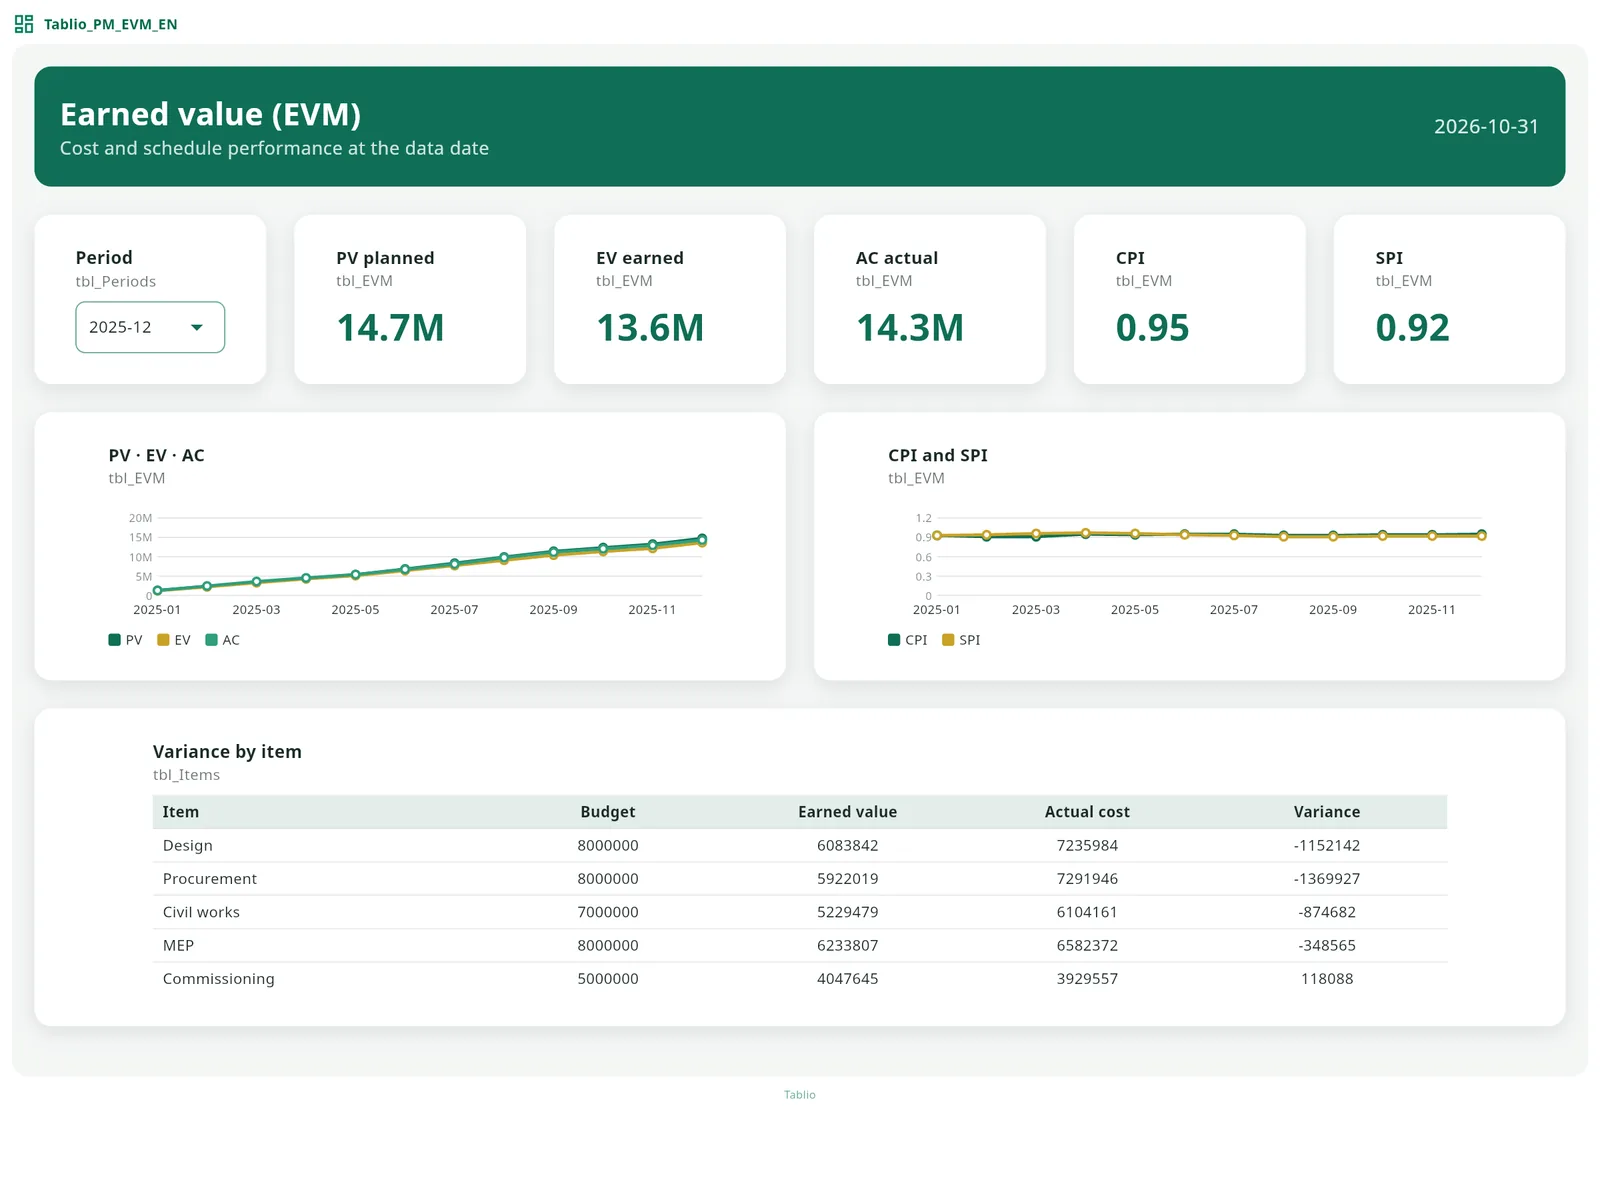
Earned value (EVM)
Planned, earned and actual value, SPI and CPI, and variance by item.

Budget vs. spend
Budget, spend and payment certificates, by category and item.

Risk register & matrix
Likelihood × impact, high and open risks, and their spread by category.

Milestones
Done, late and upcoming milestones, with dates and owners.

Resources & manpower
Planned against actual manpower, productivity by trade, and equipment.

Change orders
Change-order value, status, and time and cost impact.

Weekly report
Weekly progress, tasks, issues and decisions needed.

Health & safety (HSE)
Incidents and observations by type, safe man-hours, and the log.
A real dashboard, running in your browser
This is the “Project portfolio” dashboard as Tablio exports it, an interactive HTML page with demo data. Try the filters, periods and pages on a computer or phone, no sign-up needed.
Opens in a new tab; about 10 MB.
Try the ten templates free
Try all of Tablio free for 28 days. No credit card, no commitment.